Display Trace Links
When developing, adding a trace link in your UI can help you save time debugging.
In this walkthrough, you will share a link to your LangSmith trace using the following pattern:
from langchain.callbacks import tracing_v2_enabled
from langsmith import Client

client = Client()

with tracing_v2_enabled() as cb:
    chain.invoke({"input": "<user-input>"})
    url = cb.get_run_url()
The tracing_v2_enabled callback collects the latest trace in-memory and returns a (private) link to the trace details for easy debugging.
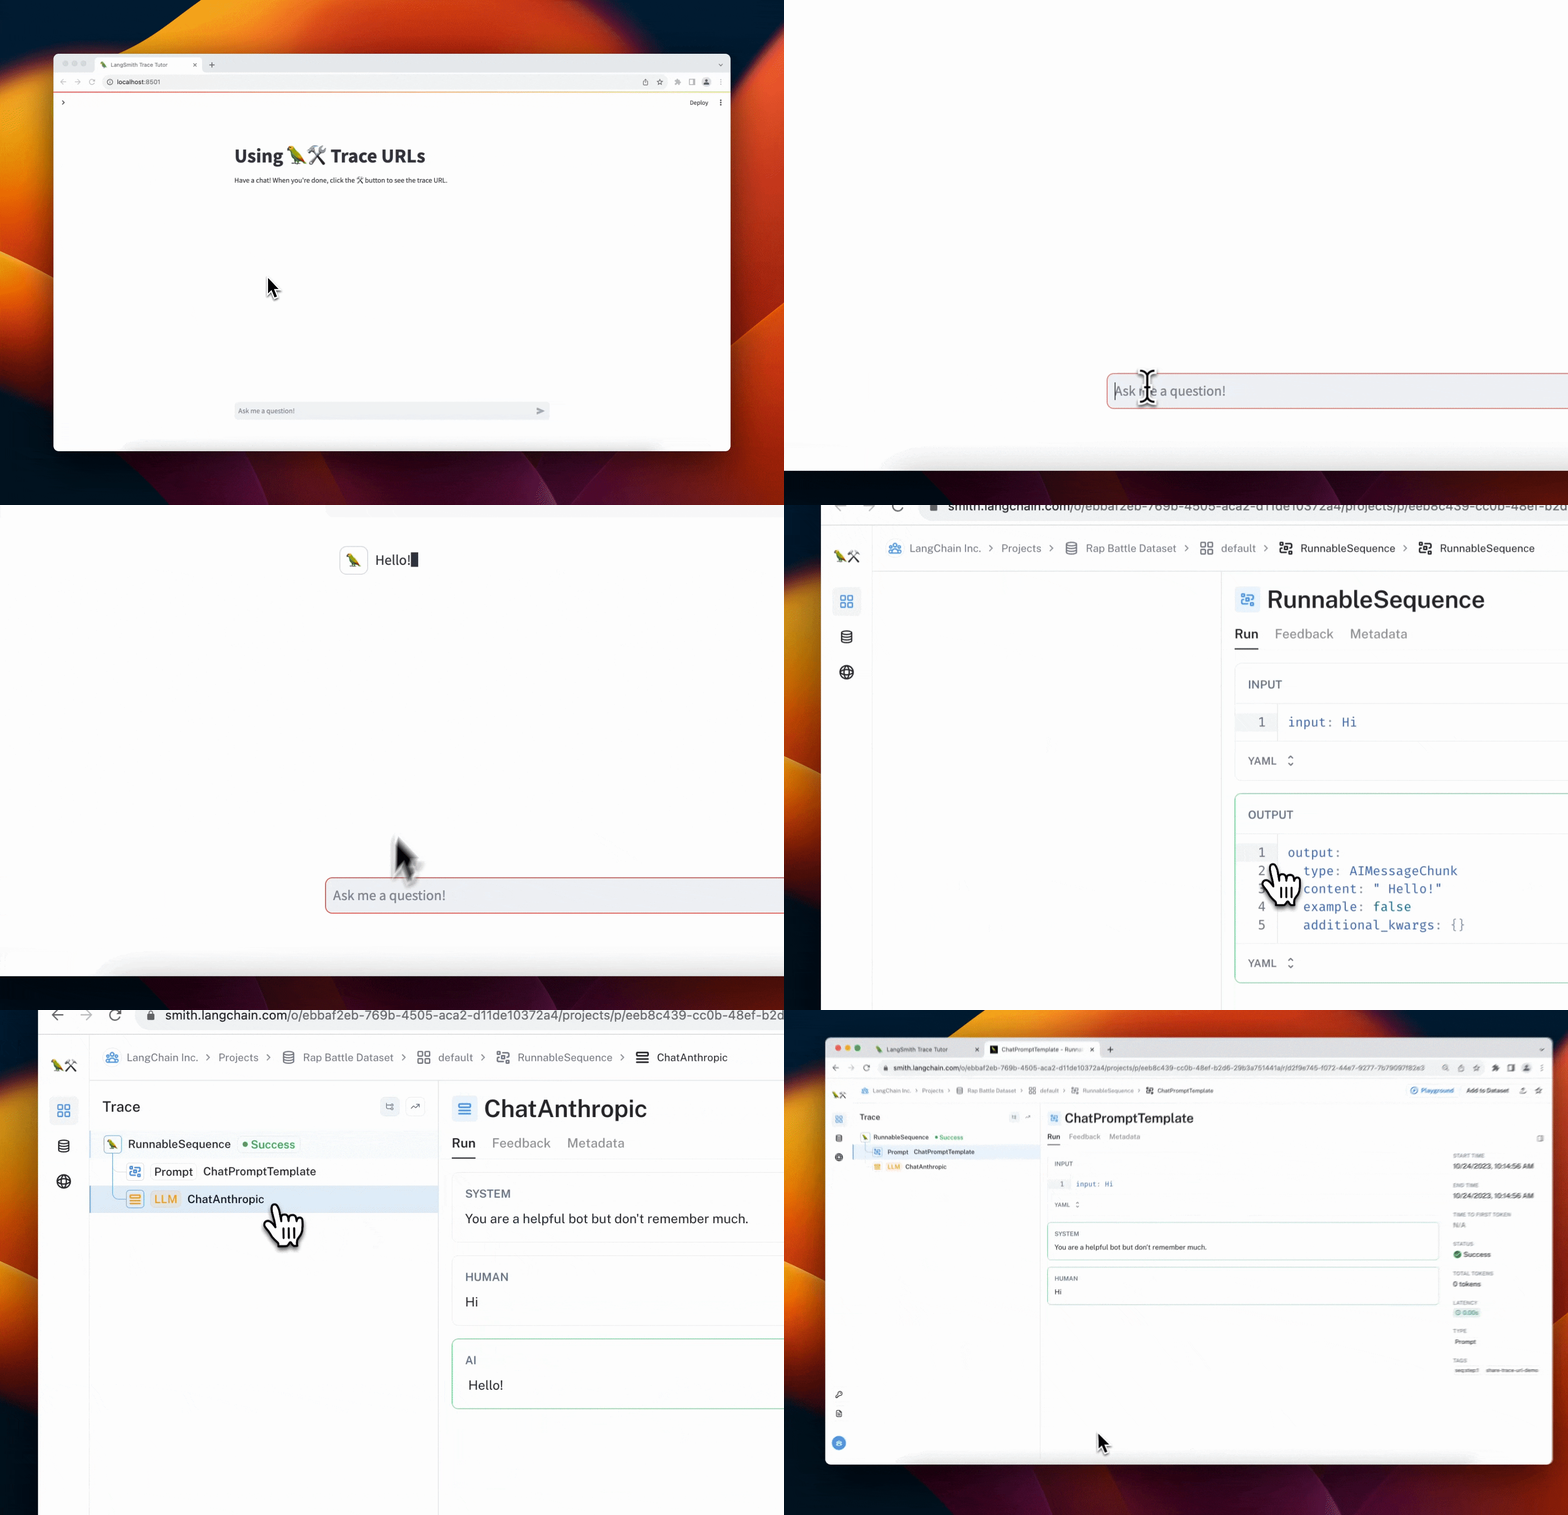
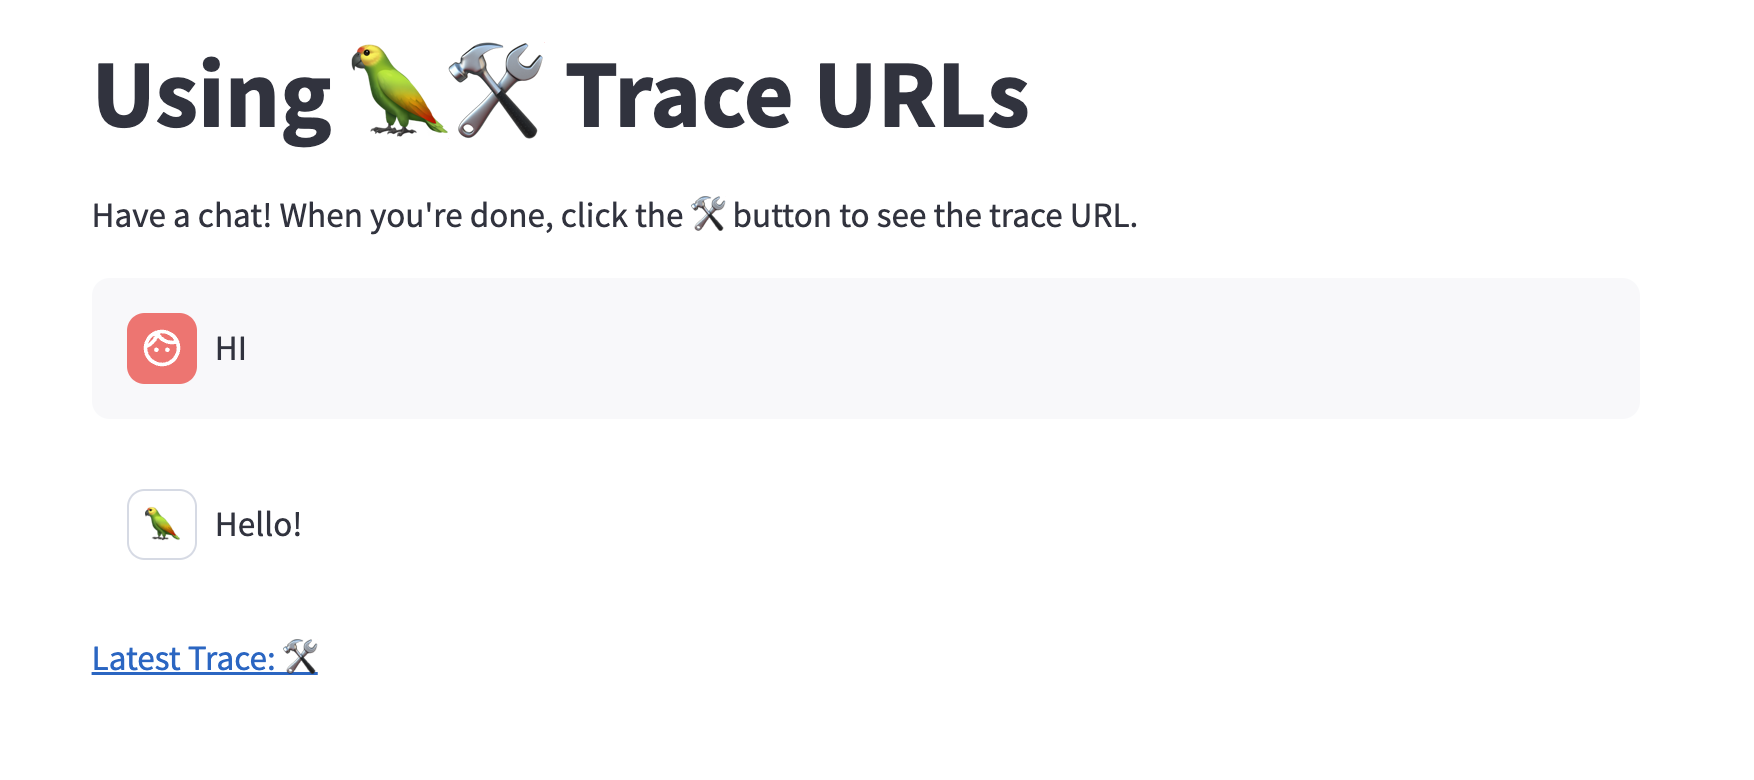
The demo app will look like this:

Setup
First, creating a python virtual environment, activate it, and install the project requirements requirements.
python -m virtualenv .venv
source .venv/bin/activate
python -m pip install -r requirements.txt
Next, set your API keys. The demo uses Anthropic (and LangSmith):
export LANGCHAIN_API_KEY=...
export ANTHROPIC_API_KEY=...
After setup is done, run the application!
ENVIRONMENT=dev python -m streamlit run app.py
This will spin up the local streamlit application. Try saying hello and clicking the trace URL!

Conclusion
This completes the tutorial! Displaying URLs inline is an easy way to avoid having to search through your project to replay or analyze a run.
