Observability Quick Start
This tutorial will get you up and running with our observability SDK by showing you how to trace your application to LangSmith.
If you're already familiar with the observability SDK, or are interested in tracing more than just LLM calls you can skip to the next steps section, or check out the how-to guides.
1. Install Dependencies
- Python
- TypeScript
pip install -U langsmith openai
yarn add langsmith openai
2. Create an API key
To create an API key head to the LangSmith settings page. Then click Create API Key.
3. Set up your environment
- Shell
export LANGSMITH_TRACING=true
export LANGSMITH_API_KEY="<your-langsmith-api-key>"
# The example uses OpenAI, but it's not necessary if your code uses another LLM provider
export OPENAI_API_KEY="<your-openai-api-key>"
4. Define your application
We will instrument a simple RAG application for this tutorial, but feel free to use your own code if you'd like - just make sure it has an LLM call!
Application Code
- Python
- TypeScript
from openai import OpenAI

openai_client = OpenAI()

# This is the retriever we will use in RAG
# This is mocked out, but it could be anything we want
def retriever(query: str):
    results = ["Harrison worked at Kensho"]
    return results

# This is the end-to-end RAG chain.
# It does a retrieval step then calls OpenAI
def rag(question):
    docs = retriever(question)
    system_message = """Answer the users question using only the provided information below:

    {docs}""".format(docs="\n".join(docs))

    return openai_client.chat.completions.create(
        messages=[
            {"role": "system", "content": system_message},
            {"role": "user", "content": question},
        ],
        model="gpt-4o-mini",
    )
import { OpenAI } from "openai";

const openAIClient = new OpenAI();

// This is the retriever we will use in RAG
// This is mocked out, but it could be anything we want
async function retriever(query: string) {
  return ["This is a document"];
}

// This is the end-to-end RAG chain.
// It does a retrieval step then calls OpenAI
async function rag(question: string) {
  const docs = await retriever(question);

  const systemMessage =
    "Answer the users question using only the provided information below:\n\n" +
    docs.join("\n");

  return await openAIClient.chat.completions.create({
    messages: [
      { role: "system", content: systemMessage },
      { role: "user", content: question },
    ],
    model: "gpt-4o-mini",
  });
}
5. Trace OpenAI calls
The first thing you might want to trace is all your OpenAI calls. LangSmith makes this easy with the wrap_openai (Python) or wrapOpenAI (TypeScript) wrappers.
All you have to do is modify your code to use the wrapped client instead of using the OpenAI client directly.
- Python
- TypeScript
from openai import OpenAI
from langsmith.wrappers import wrap_openai

openai_client = wrap_openai(OpenAI())

# This is the retriever we will use in RAG
# This is mocked out, but it could be anything we want
def retriever(query: str):
    results = ["Harrison worked at Kensho"]
    return results

# This is the end-to-end RAG chain.
# It does a retrieval step then calls OpenAI
def rag(question):
    docs = retriever(question)
    system_message = """Answer the users question using only the provided information below:

    {docs}""".format(docs="\n".join(docs))

    return openai_client.chat.completions.create(
        messages=[
            {"role": "system", "content": system_message},
            {"role": "user", "content": question},
        ],
        model="gpt-4o-mini",
    )
import { OpenAI } from "openai";
import { wrapOpenAI } from "langsmith/wrappers";

const openAIClient = wrapOpenAI(new OpenAI());

// This is the retriever we will use in RAG
// This is mocked out, but it could be anything we want
async function retriever(query: string) {
  return ["This is a document"];
}

// This is the end-to-end RAG chain.
// It does a retrieval step then calls OpenAI
async function rag(question: string) {
  const docs = await retriever(question);

  const systemMessage =
    "Answer the users question using only the provided information below:\n\n" +
    docs.join("\n");

  return await openAIClient.chat.completions.create({
    messages: [
      { role: "system", content: systemMessage },
      { role: "user", content: question },
    ],
    model: "gpt-4o-mini",
  });
}
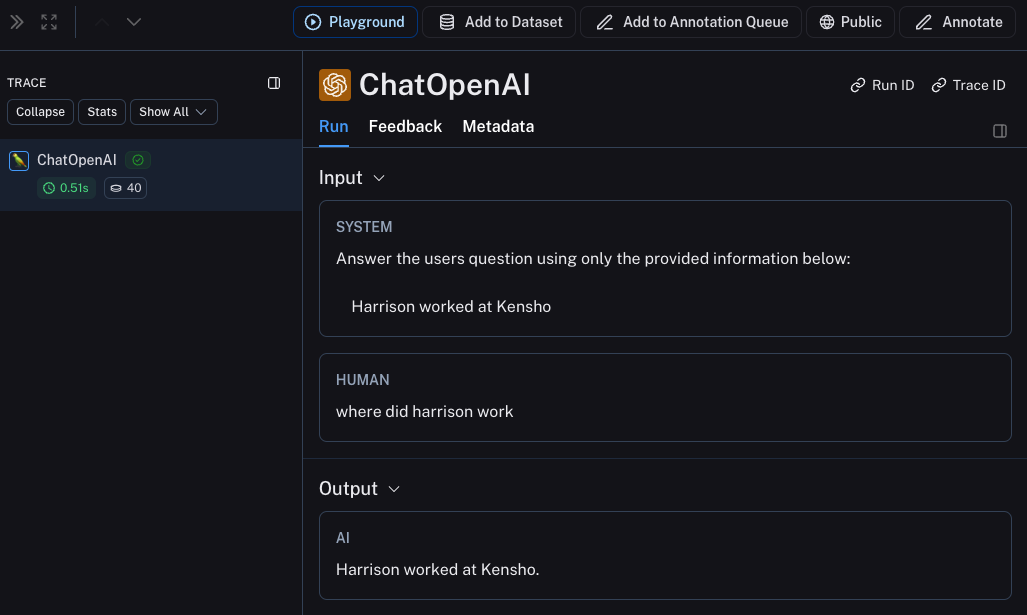
Now when you call your application as follows:
rag("where did harrison work")
This will produce a trace of just the OpenAI call in LangSmith's default tracing project. It should look something like this.
6. Trace entire application
You can also use the traceable decorator (Python or TypeScript) to trace your entire application instead of just the LLM calls.
- Python
- TypeScript
from openai import OpenAI
from langsmith import traceable
from langsmith.wrappers import wrap_openai

openai_client = wrap_openai(OpenAI())

def retriever(query: str):
    results = ["Harrison worked at Kensho"]
    return results

@traceable
def rag(question):
    docs = retriever(question)
    system_message = """Answer the users question using only the provided information below:

    {docs}""".format(docs="\n".join(docs))

    return openai_client.chat.completions.create(
        messages=[
            {"role": "system", "content": system_message},
            {"role": "user", "content": question},
        ],
        model="gpt-4o-mini",
    )
import { OpenAI } from "openai";
import { traceable } from "langsmith/traceable";
import { wrapOpenAI } from "langsmith/wrappers";

const openAIClient = wrapOpenAI(new OpenAI());

async function retriever(query: string) {
  return ["This is a document"];
}

const rag = traceable(async function rag(question: string) {
  const docs = await retriever(question);

  const systemMessage =
    "Answer the users question using only the provided information below:\n\n" +
    docs.join("\n");

  return await openAIClient.chat.completions.create({
    messages: [
      { role: "system", content: systemMessage },
      { role: "user", content: question },
    ],
    model: "gpt-4o-mini",
  });
});
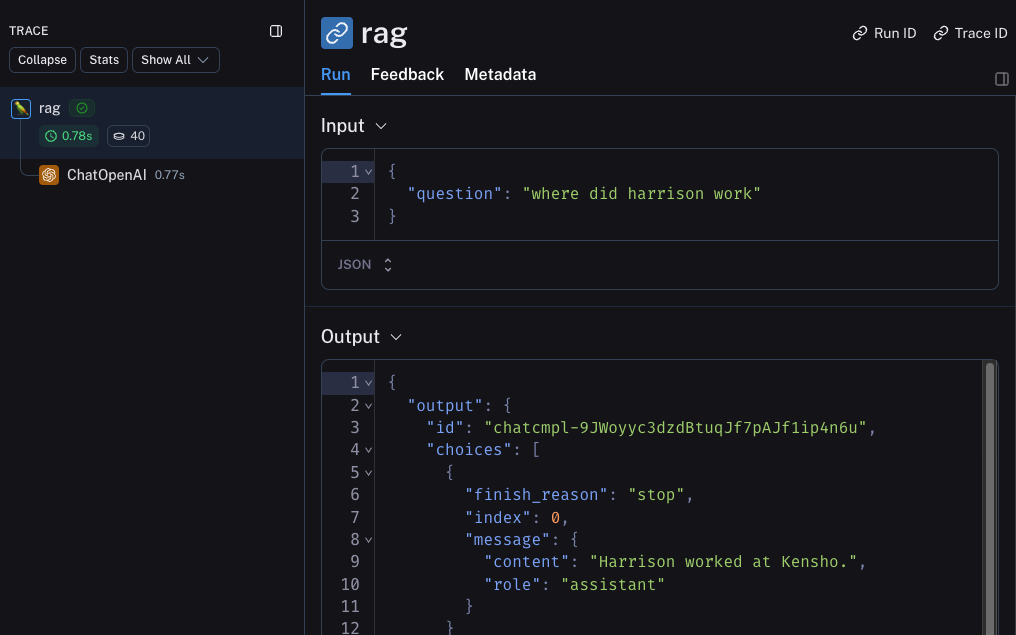
Now if you call your application as follows:
rag("where did harrison work")
This will produce a trace of just the entire pipeline (with the OpenAI call as a child run) - it should look something like this
Next steps
Congratulations! If you've made it this far, you're well on your way to being an expert in observability with LangSmith. Here are some topics you might want to explore next:
Or you can visit the how-to guides page to find out about all the things you can do with LangSmith observability.
If you prefer a video tutorial, check out the Tracing Basics video from the Introduction to LangSmith Course.